
On this page
The best crypto indicators are the few you understand deeply, not the twelve on a crowded chart. What moving averages, RSI, and volume each tell you, and what to ignore.
The best crypto indicators for most traders are moving averages, RSI, and volume. That short list is not a simplification for beginners. It is where disciplined spot traders tend to land after trying everything else, because almost every indicator in your exchange’s charting menu is doing the same job: repackaging past price into a different shape.
That last point is worth sitting with before you add anything to a chart. An indicator cannot know anything the price history does not contain. What a good indicator does is make one specific thing easier to see: the direction of the trend, the speed of a move, or the conviction behind it. Pick one tool for each of those three jobs and you are done. Stack five tools that all measure the same job and you have a chart that agrees with itself while teaching you nothing.
This guide covers the three that earn their place, how to read each one on crypto’s fast markets, one honorable mention, and the habits that make any indicator worthless.
Moving Averages: The Trend Filter
A moving average draws the average closing price over a set number of periods as a line. The 50-day and the 200-day are the standard pair on crypto charts, and they answer the only question that should gate every trade you take: which direction is the market moving?
Price above a rising 200-day average is an uptrend. Price below a falling one is a downtrend. That sounds too simple to be useful, and it is the discipline most losing trades were missing. Buying a coin that is 20% off its high feels like a discount; the 200-day line is how you tell a pullback in an uptrend from a knife still falling.
Use them as a filter, never a trigger. The moving average tells you which trades are allowed (longs in an uptrend, patience in a downtrend). Your entry still comes from price itself: a level holding, a range breaking. Traders who buy simply because price touched the 50-day average are handing the decision to a lagging line.
The lag is the tradeoff to respect. A moving average is built from old prices, so it confirms trends late and exits them late. In crypto, where a trend can travel a long way in a week, the lag is the price you pay for not being faked out by every red day.
RSI: The Speedometer
The Relative Strength Index measures how fast price has been moving, on a scale of 0 to 100, over its standard 14-period window. High readings (above 70) mean the recent move up was unusually fast; low readings (below 30) mean the move down was.
Here is where most traders misuse it: overbought does not mean sell. In a real crypto uptrend, RSI can sit above 70 for weeks while price keeps climbing. Selling every overbought reading in a bull market is a machine for exiting winners early. The readings mean the move was fast, and fast is what strong trends look like.
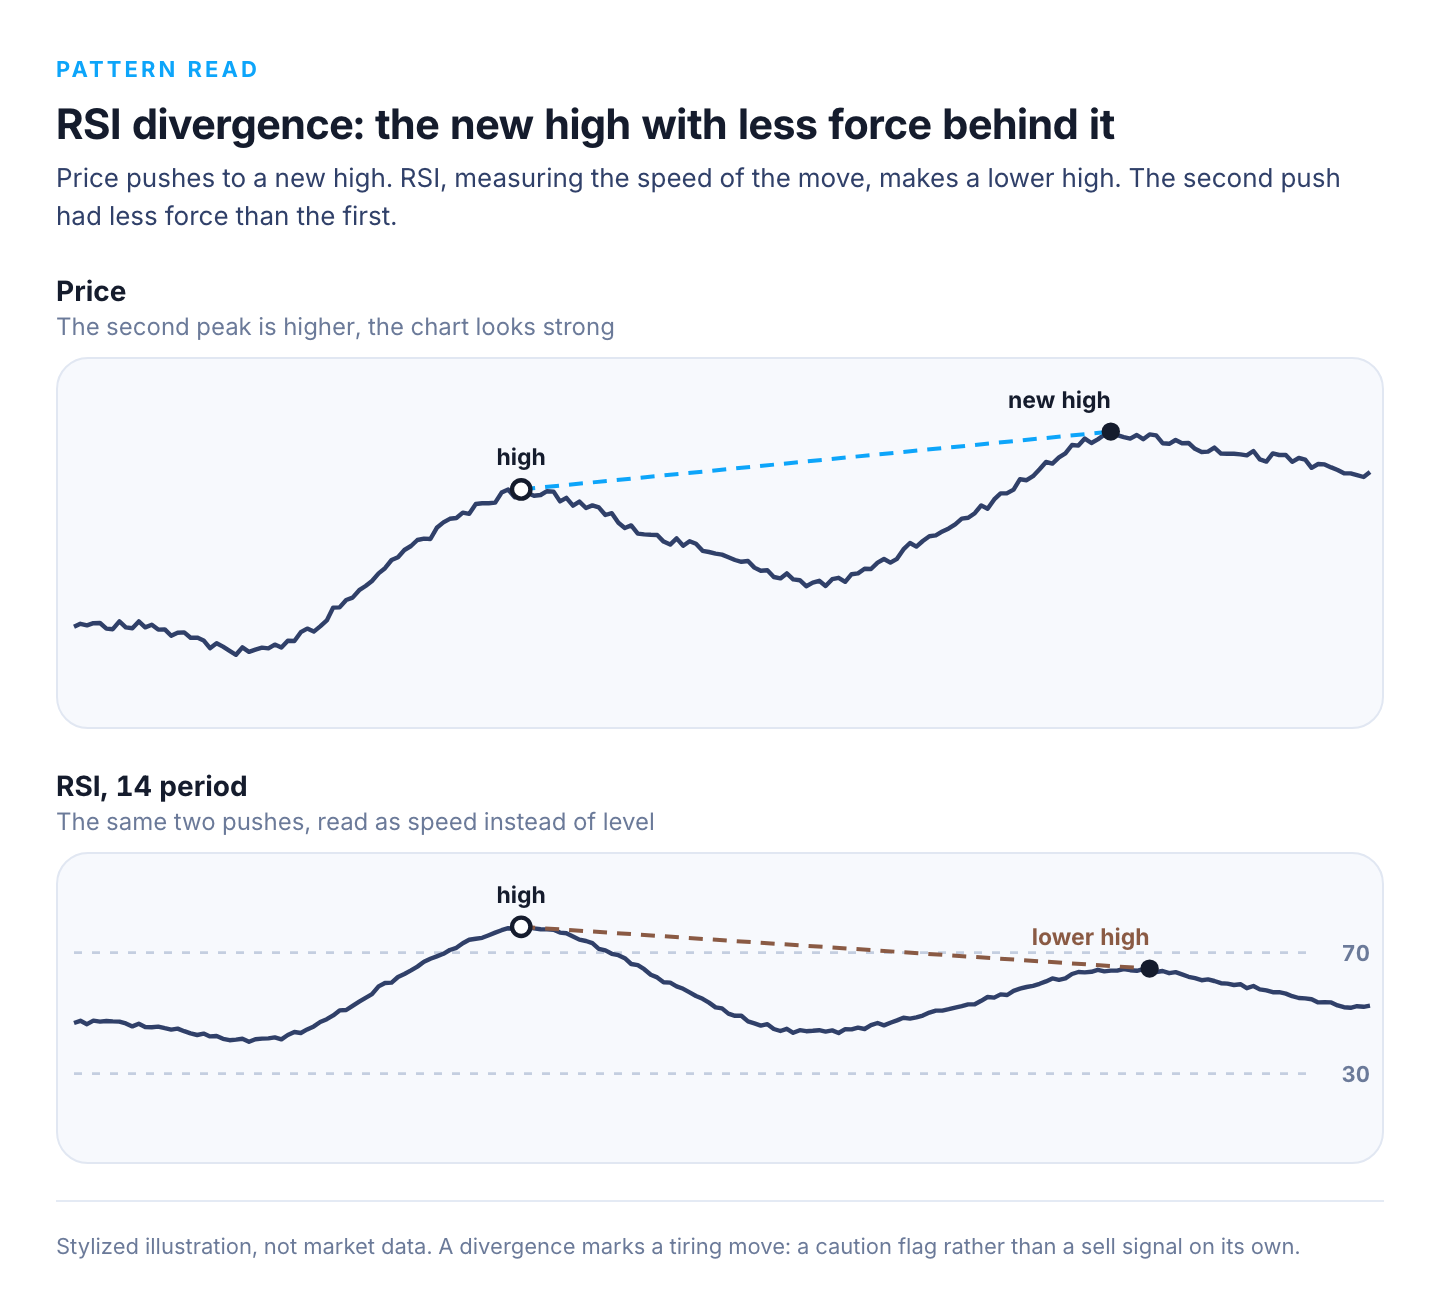
RSI earns its spot for two narrower reads. Divergence: price makes a new high but RSI makes a lower high, telling you the second push had less force than the first. Divergences mark tiring moves, and they are a caution flag rather than a sell signal on their own. And range extremes: when a coin is moving sideways rather than trending, RSI near 30 at the bottom of the range and near 70 at the top genuinely does mark the turns. The skill is knowing which regime you are in, which is what the moving averages already told you.
Volume: The Lie Detector
Volume is the amount traded in each period, and it is the only tool on this list that adds information price alone does not show, because it measures participation instead of price.
Its job is confirmation. A breakout above a resistance level on three times the average volume has real buyers behind it. The same breakout on thin volume is a rumor: nobody showed up, and thin breakouts are the ones that reverse on you a day later. Before acting on any move, the volume bar is the one-second check of whether the move is real.
In crypto specifically, volume reads best at levels. When a coin returns to a price where volume previously spiked, you are watching a level the market has already fought over once. Those are the prices where support and resistance actually live, and they are where stop placement should come from before any indicator gets involved.
One honest caution: reported volume varies in quality across venues, so watch the volume pattern on the one exchange where you trade rather than an aggregate of places you have never used.
Do the Other Best Crypto Indicators Add Anything?
MACD compresses two moving averages into a momentum read: when the faster average pulls away from the slower one, the trend is gaining speed, and its crossovers flag the shifts. It is genuinely useful, and it is also built entirely from the moving averages you already have. If your chart has the 50 and 200 and you understand them, MACD is a convenience rather than new information. Add it if the visual helps you; skip it without guilt.
That logic is the test for every other indicator in the menu. Bollinger Bands are a moving average with volatility rails. Stochastic is RSI’s cousin. Adding them does not add signal; it adds ways to disagree with yourself at the moment you most need a clear answer.
The Habits That Make Indicators Work
Three or fewer, one per job. Trend filter, speed read, participation check. If two tools on your chart answer the same question, delete one.
Decide the reading in advance. “RSI divergence at the top of the range means I tighten my exit” is a rule you can follow and review. Opening the chart and asking the indicators how you feel about your position is astrology with extra steps. Write the rules down and let the weekly review judge them.
Respect the market’s regime. Every tool here reads differently in a trend than in a range. The most common way indicators lose traders money is a range-market playbook applied to a trending market, or the reverse.
Let price overrule everything. If BTC breaks a major support level with volume, the fact that an oscillator looks “oversold” is not a reason to catch it. Indicators summarize price. Price is the thing itself.
Where Analysis Stops Being the Constraint
At some point the indicators are set, the rules are written, and your reads start being right more often than wrong. What you notice next is that the quality of your analysis and the size of its reward are two different things. A well-read breakout pays the same percentage on any account; in dollars, being right about a 10% move earns $50 on a $500 position and $2,500 on a $25,000 position, and nothing about the chart work changes between the two.
That gap is why some spot traders eventually look at funded trading, where a firm provides the trading capital and you keep most of the profit. The model: pay a fee, pass a trading test that checks you can trade within loss limits, then trade the firm’s capital. At Breakout, a $100,000 account starts at $330 for the test fee, the most you can lose on the attempt, and funded traders keep 80% of profits with 90% available as an upgrade. How funded trading works, including what happens if you lose, is its own read.
The relevant point for this article is narrower: the skills the trading test measures are the ones the indicators above are teaching you anyway. Reading trend, waiting for confirmation, cutting what is wrong. The chart work transfers.
The best crypto indicators are a moving average for trend, RSI for speed, and volume for conviction: one tool per job, rules written before the trade, and price overruling all of it. Everything else in the menu is the same information wearing a different outfit.